E-Commerce ETL Data Analytics Pipeline
Tech Stack
Description
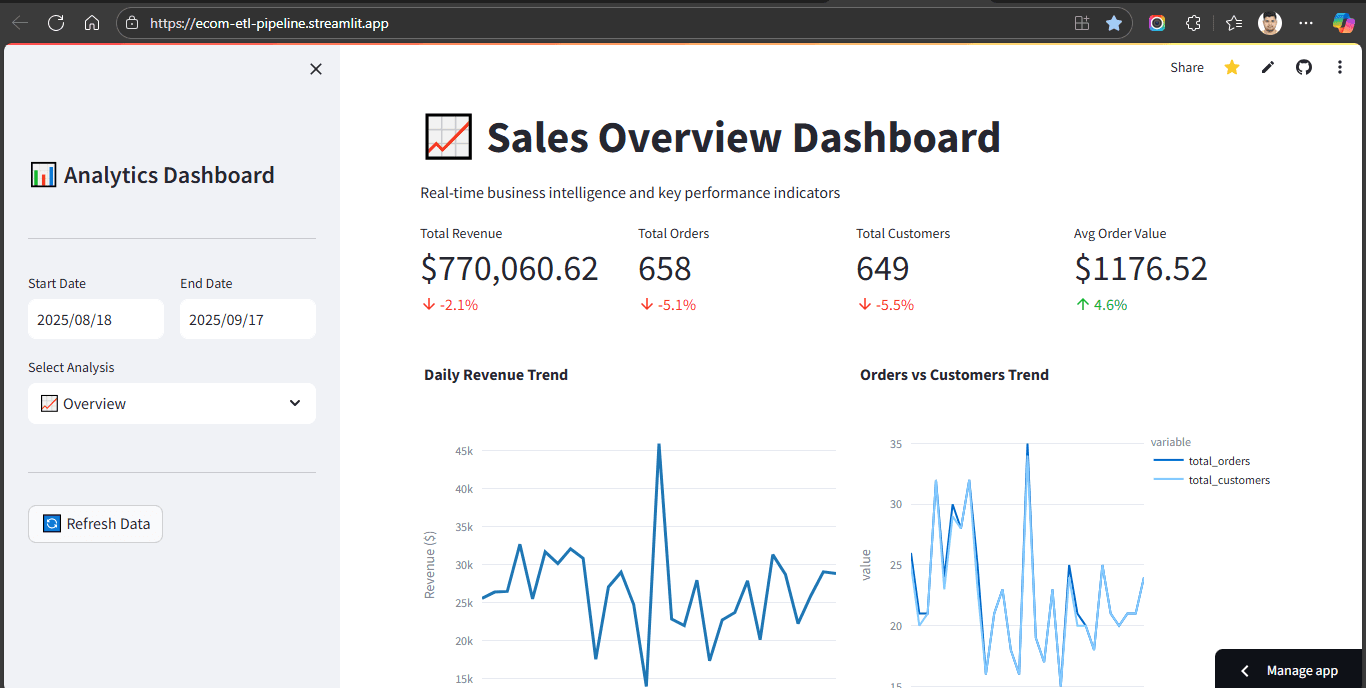
The dashboard is organized into several pages for comprehensive analysis. The Overview pane shows High-level KPIs, daily revenue trends, and an orders vs. customers chart. The Customers pane shows Detailed analysis of customer segments and retention metrics. The Products pane shows Treemap of revenue by category and a list of the top-performing products. The Advanced Analytics pane shows Monthly performance, revenue growth rate, and forecasting.
Deployment: The dashboard for this project is deployed on Streamlit Community Cloud. The app is linked to this GitHub repository. The DATABASE_URL is configured securely using Streamlit's secrets management. The app automatically redeploys upon any push to the main branch.
- Automated ETL Pipeline: Extracts raw data, cleans and transforms it with business logic, and loads it into a structured data warehouse.
- Interactive Dashboard: A multi-page Streamlit application for real-time BI, featuring KPIs, trend analysis, and forecasting.
- Cloud-Native Database: Utilizes a serverless PostgreSQL database from Neon.tech for scalable and efficient data storage.
- Scheduled Updates: The pipeline is designed with scheduling in mind, simulating daily full-loads and hourly incremental updates.
- Business Intelligence: Generates key metrics like customer lifetime value, product performance, revenue trends, and retention rates.
Page Info
Walkthrough Video
An end-to-end data engineering project that builds a complete ETL pipeline for e-commerce data, stores it in a PostgreSQL data warehouse, and presents real-time business intelligence through an interactive Streamlit dashboard.